A11y Resolved Bug
Comparisons: September 5 - 11 compared to total A11y bugs
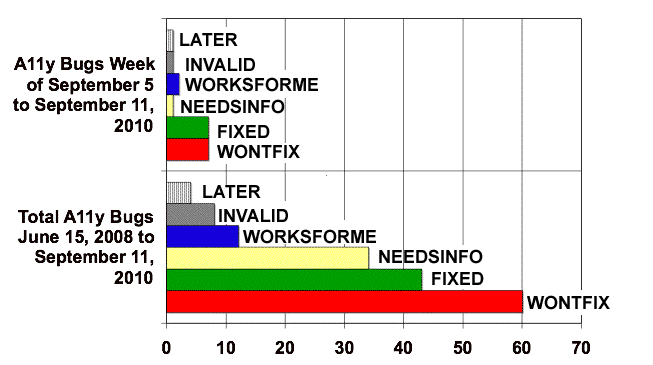
Chart 1: Comparing two timeframes and six bug categories

Chart data: A11y Resolved Bug Comparison
|
|
WONTFIX |
NEEDSINFO |
FIXED |
WORKSFORME |
INVALID |
LATER |
| Week of September 5 - 11, 2010 |
7 |
1 |
7 |
2 |
1 |
1 |
| Total June 15, 2008 to August 21, 2010 |
60 |
34 |
43 |
8 |
8 |
4 |
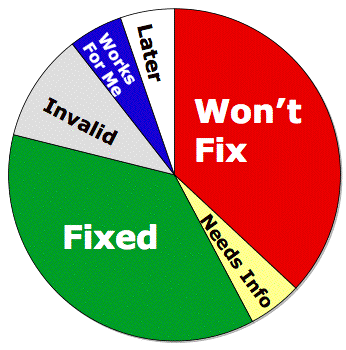
Chart 2: Resolved bugs for the week of September 5 - 11,
2010

Chart data: Number and Percentages for the Week of September 5
- 11, 2010
|
|
WONTFIX |
NEEDSINFO |
FIXED |
WORKSFORME |
INVALID |
LATER |
| Number |
7 |
1 |
7 |
1 |
2 |
1 |
| Percentage |
37% |
5% |
37% |
5% |
11% |
5% |
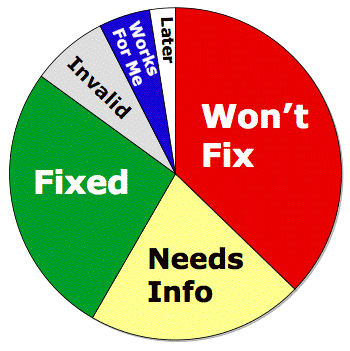
Chart 3: Resolved Bugs from June 15, 2008 to September 11,
2010

Chart data: Number and Percentages from June 15, 2008 to
September 11, 2010
|
|
WONTFIX |
NEEDSINFO |
FIXED |
WORKSFORME |
INVALID |
LATER |
| Number |
60 |
34 |
43 |
8 |
12 |
4 |
| Percentage |
38% |
21% |
27% |
5% |
7% |
2% |


