PART ONE: ISOTHERM MAPS
(5)1.
Following your instructor's directions, make an isotherm map of the temperature
data which are plotted on the map of the eastern North America. (The maps
will be distributed in Lab). Use 10 degree contour intervals and label
all isotherms. After completing the map, answer the following questions:
(2)2. What season do you think this map represents? Why?
(2) 3. Where is the strongest temperature gradient on your map? Where is the weakest temperature gradient ? Why?
(2)4.
Describe the effects of the Great Lakes on the 50 degree isotherm.
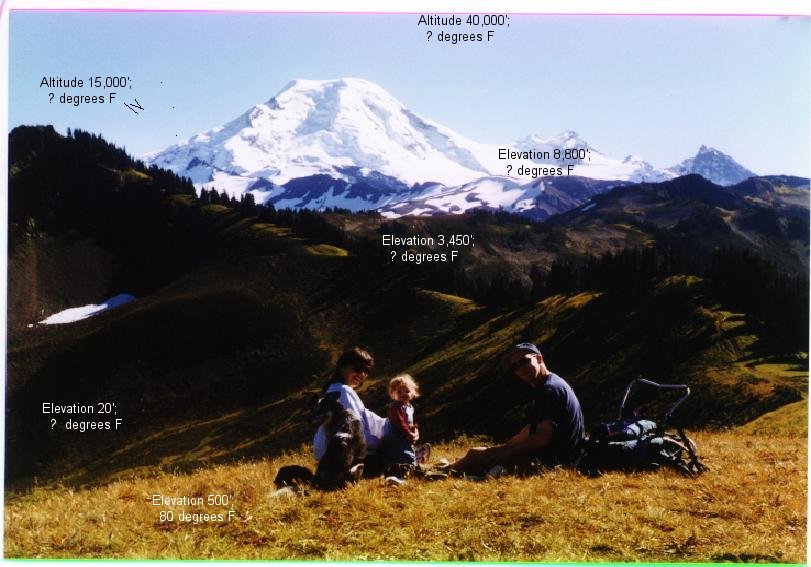
PART TWO: THE ENVIRONMENTAL LAPSE RATE
(5)5. Using Figure One and the environmental lapse rate, determine the air temperatures at the altitudes listed on the Figure. (Notice that the temperature at 500 ft. is given).
(1)6. Under the conditions above, at what altitude would freezing occur?
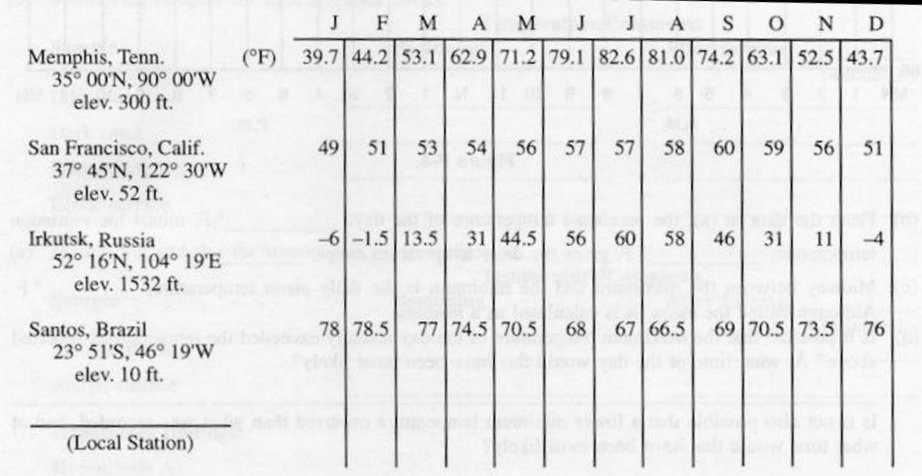
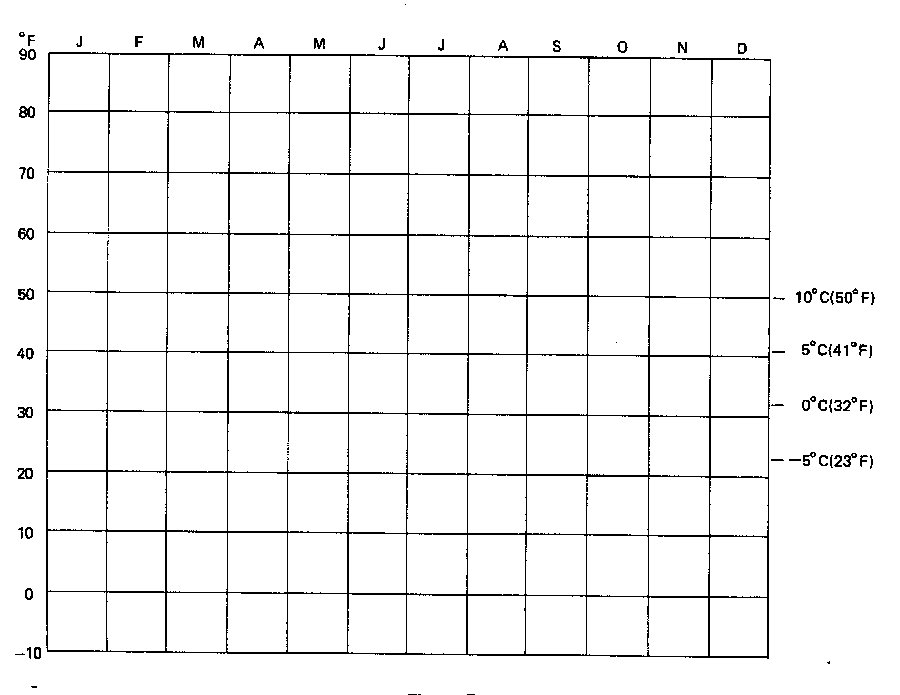
PART THREE: ANNUAL CYCLE OF TEMPERATURE
(5)7. In Figure Two, you are given the mean monthly temperatures for Memphis, San Francisco, Irkutsk (Russia) and Santos (Brazil). On Figure Three, plot the data for each station, connecting the points with smooth curves. Use a different color for each station.
(2)8. Calculate the annual range of temperatures and the mean annual temperature for each station.
(3)9. Describe and explain the differences in the temperature curves for Memphis and San Francisco.
(2)10. Irkutsk is an example of a continental location. What characteristics of the temperature curve identify it as such?
(3)11.
Make at least three comparisons of how the temperature curve for Santos
differs from the temperature curve for Memphis.