WAVE Icon Overview
The WAVE shows the original page, with icons and indicators inserted. The number of icons presented on the page can be a bit overwhelming until a person learns what each icon means and works with the tool for a while.
| Icon | Meaning | Explanation |
|---|---|---|
| Error | Red icons are bad. If you see red, there is almost certainly an accessibility issue. | |
| Contrast | Identifies WCAG 2.1 Level AA contrast issues. | |
| Alert | Orange icons indicate likely accessibility issues or where improvement could be needed. | |
| Feature | Green icons are typically good. They are accessibility features, but you must determine if they are implemented appropriately. | |
| Structural Element | Blue icons reveal the underlying structure and meaning of the Web page. | |
| ARIA | Purple icons are Accessible Rich Internet Applications (ARIA ) roles, states, or properties. |
How to Check a Page
1. Select an Icon in the Sidebar to Highlight it in Your Page
Icons in the sidebar correspond to the icons in your original page. For instance if you select an error icon in the list of errors in the sidebar, a red dashed outline will appear around where the error occurs in your page.
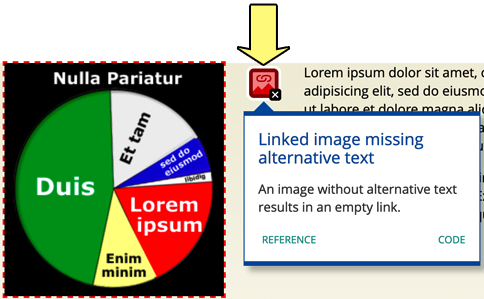
2. Select the Icon in Your Page for a Brief Explanation
When you select an icon on your page, a brief message explaining the problem will popup.
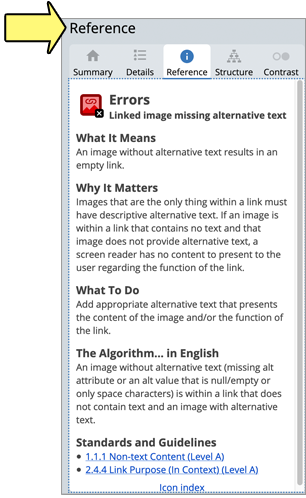
3. Select the "REFERENCE" Link in the Popup for Additional Documentation
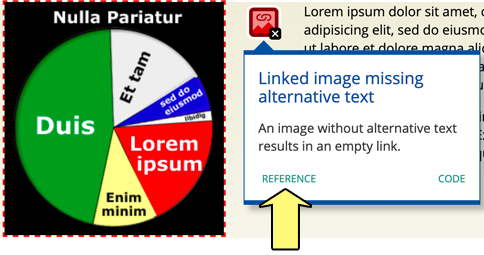
When the "REFERNCE" link is selected, documentation for that particular error will appear in the sidebar regarding what it means, why it matters, how to fix it, The Algorithm in English, and links to standards and guidelines.
For more information on writing text alternatives consult Images: The short and long of it.
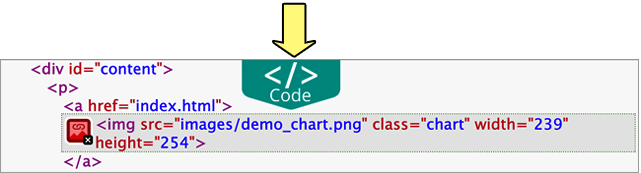
4. Select the Code Tab to View Markup
If you want to dig into the markup, you can view your code for items that are flagged. Just select the “code” tab at the bottom of your original page.