Previous Class Blackboard Items
(in chronological order)
 This
will be the home page for COMP 3220 for Spring 2003. Please return for
updates as the semester approaches. This
will be the home page for COMP 3220 for Spring 2003. Please return for
updates as the semester approaches.
 Introducing the first
project, The Autobiography in Four Images. Introducing the first
project, The Autobiography in Four Images.
Journal Entry #1. At the class
discussion board in a folder called "Journal Entry #1: Bang,"
write an informal paragraph that does the following:
Use one or two of Molly Bang's principles to consider ways of editing
one of your photos for the Autobiography in Four
Images assingment. What are some visual possibilities for cropping,
framing, and/or scaling the photo to convey the feelings you have about
the image, and that you want to convey to a viewer? What are the
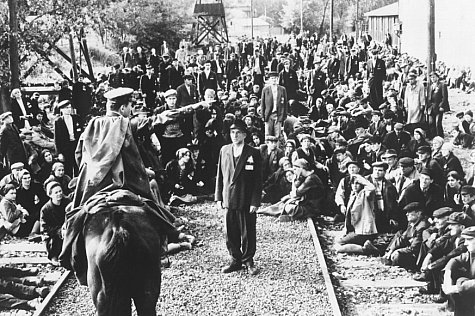
feelings you want to bring out? 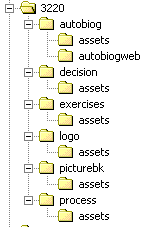 Consider this example, which we'll look
at together.
Consider this example, which we'll look
at together.
On your Zip disk,
be sure you have created a set of folders like those on the on the right
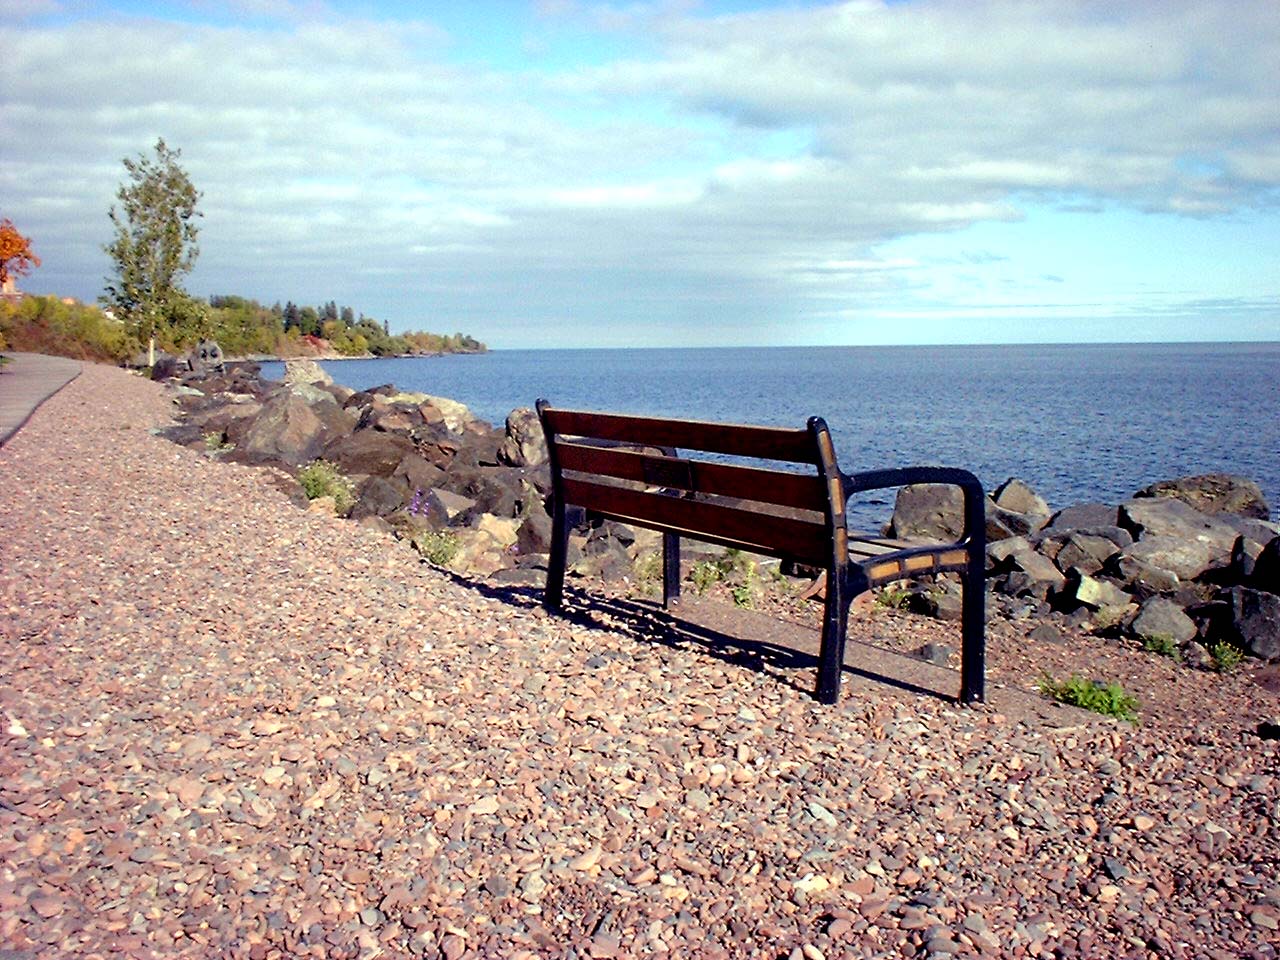
We'll be using this
raw digital image for the Beginning Banner Techniques Exercise
during the first week.
When we complete the
Beginning Banner Techniques Exercise, I'll ask you to post it to
your Web space (the exercises folder in your "www" folder on
the server) using a file transfer program called WS-FTP.
- Open the directions
for using WS-FTP from ITSS in a different browser window or tab
and then follow those directions to set up FTP to access your "www"
folder. Come back here and read item 2 below before you transfer
any files!
- Using FTP, you will need to make a new directory (a new "folder")
in "www" on the server called "exercises." Use WS-FTP's
"MkDir" button to make a new directory in the "Remote
System" window on the right side.
- Then, use your Web browser to go to the Web address where the banner
image should be. Assuming you FTP'ed the image to the top level of your
"www" folder on the server, the address would be <http://www.d.umn.edu/~youruserid/exercises/banner.jpg>
with your actual user id appearing there after the tilda.
- Once you've successfully seen your banner, copy the URL from the location
window at the top of your browser (to be sure you've got it exactly
right) and send it to me in an e-mail message with the subject line
"beginning banner"
newbanner.psd
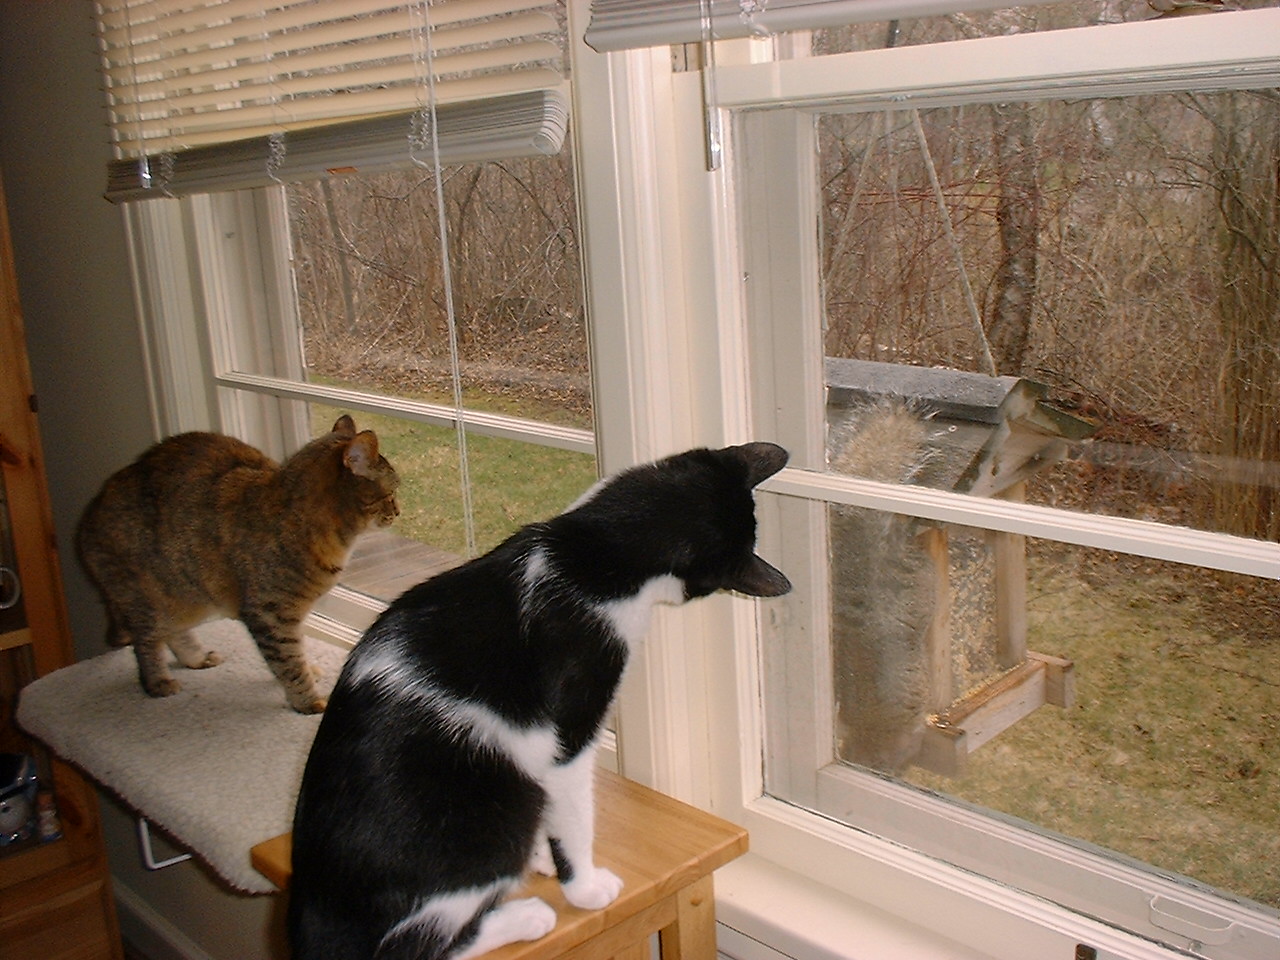
I'll use this photo,
"Squirrel Emergency" to survey
some of the tools in Photoshop. Use a photo of your own to experiment
with, or use this photo if you like. 
Introducing the next
project, Representing Data for a Decision.
Today, we'll try an
in-class activity called "Borrowing the
Neighbor's Tools"
< back to class blackboard >
Data Visualization
Exercise
Today, we're going to work together on an exercise in data visualization,
which you'll turn in at the end of class. We'll take it in 8 steps.
1. Choose a neighbor to work with and pair up at one computer.
2. With your neighbor, take a look at NOAA's Duluth
weather data for last month. Study the table of numbers so you understand
what they indicate. You might also scroll down to read the "Remarks"
at the bottom of the page to get some idea of what the numbers might show.
Your ultimate task will be to hand-draw some kind of data graphic (chart,
map, etc.) to "visualize" some point you want to draw out of
these numbers. But, before you get out a sheet of paper....
3. Let's entertain some various possibilities for graphically representing
this data in a telling way. No sense just drawing the first kind of graphic
that comes to mind.
Go back to your own computer, go to York University's Gallery
of Data Visualization, and browse through their good and bad examples
of data visualization.
4. From the Gallery, pick one visualization that you think suggests
some interesting, even radical possiblities for representing quantities
and making them "speak" visually (or that demonstrates what
we absolutely should avoid doing). Study the example so you understand
what it shows and how it shows it
5. Get back together with your neighbor and talk about each other's examples,
then separate again to...
6. click to the Webx discussion called "Data
Visualization Examples" and post a few sentences in message with
the following:
- the URL of the large size graphic
- your explanation/summary of what data that graphic shows and its point
or significance being drawn from the data by the designer
- a comment or two on the strengths or weaknesses of the graphic, especially
as they might realize Tufte's Six Principles of "Statistical Design"
from page 53 of Visual Explanations:
1. documenting sources and characteristis of the data
2. enforcing appropriate comparisons
3. demonstrating mechanisms of cause and effect
4. expressing those mechanisms quantitatively
5. recognizing the inherently multivariate nature of analytic problems
6. inspecting and evaluating alternative explanations
7. Once you've posted your message, go back to the weather
data: with your neighbor, talk about a focus you'd like to bring out
of the data and which kinds of data you'll need to include. If you need
other data to make comparisons (like 30-year averages, for example), check
out NOAA's Northland
Climate page.
8. Wiith your neighbor, talk about what forms the data graphic might
take and decide on one. On a sheet of paper (you can decide with your
neighbor who's the better artist), collaborate on the design and production
of a full-page data graphic using the data you have selected. Pencil is
fine. Write a sentence on the page that explains what your graphic shows.
Both your names should appear on the sheet of paper.
Be ready to turn in the page by the end of class.
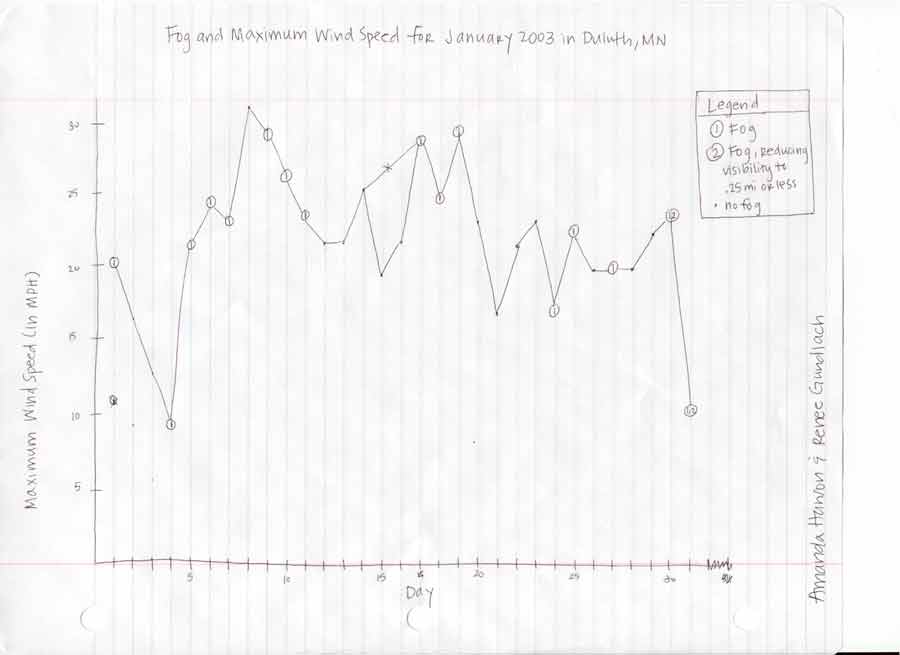
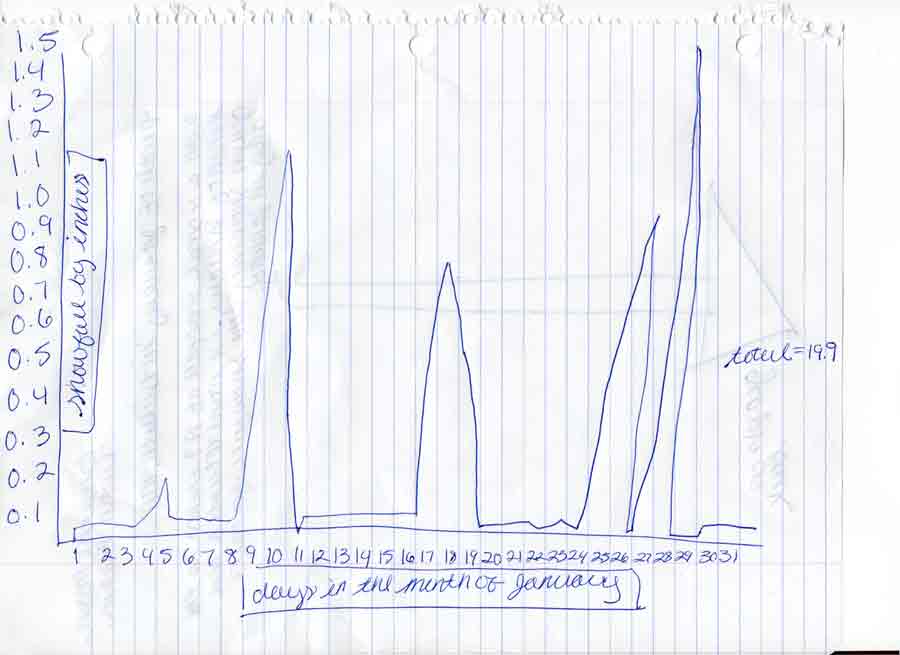
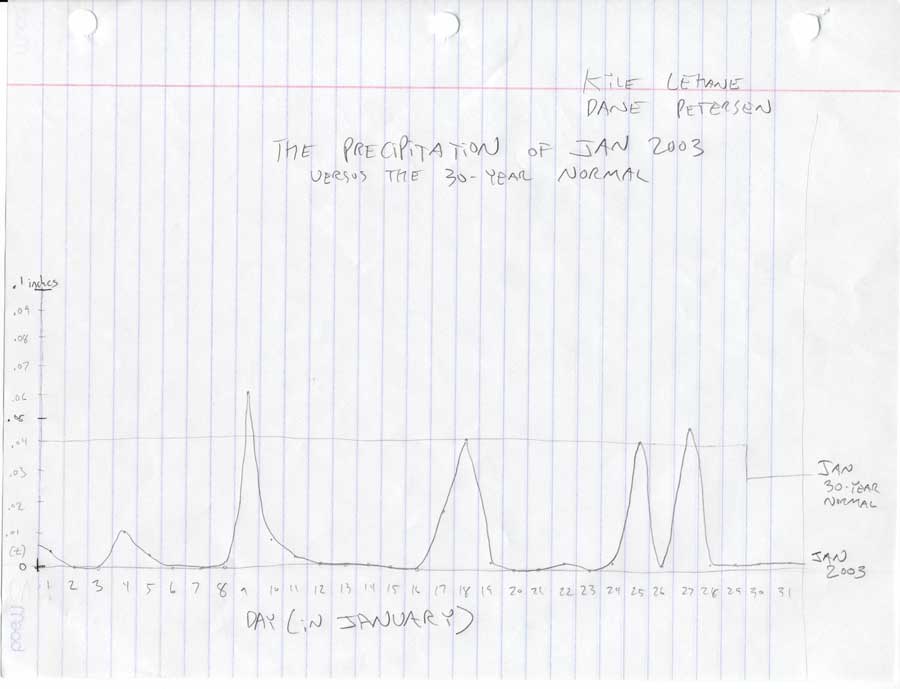
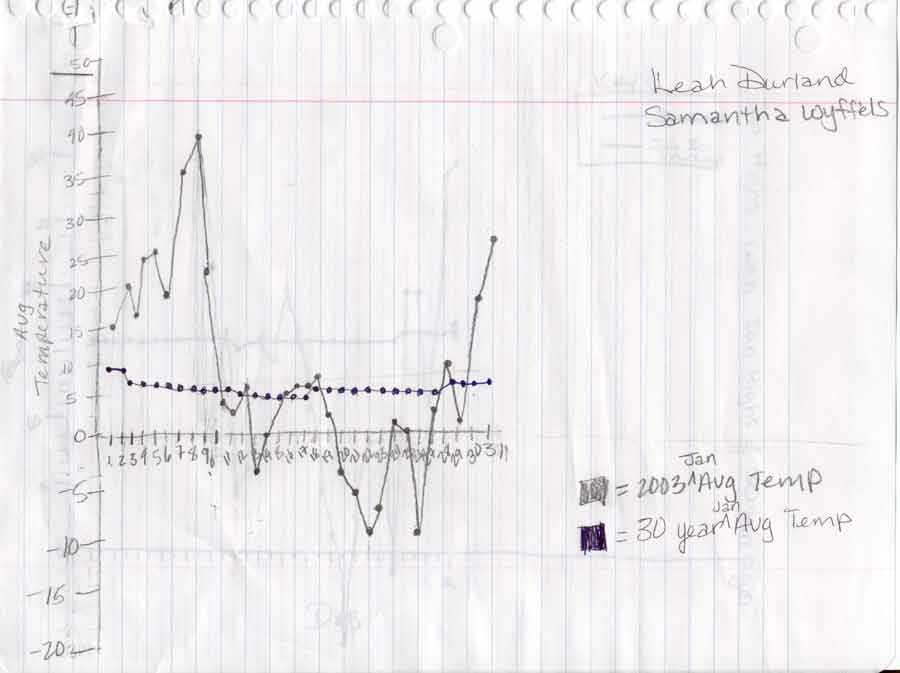
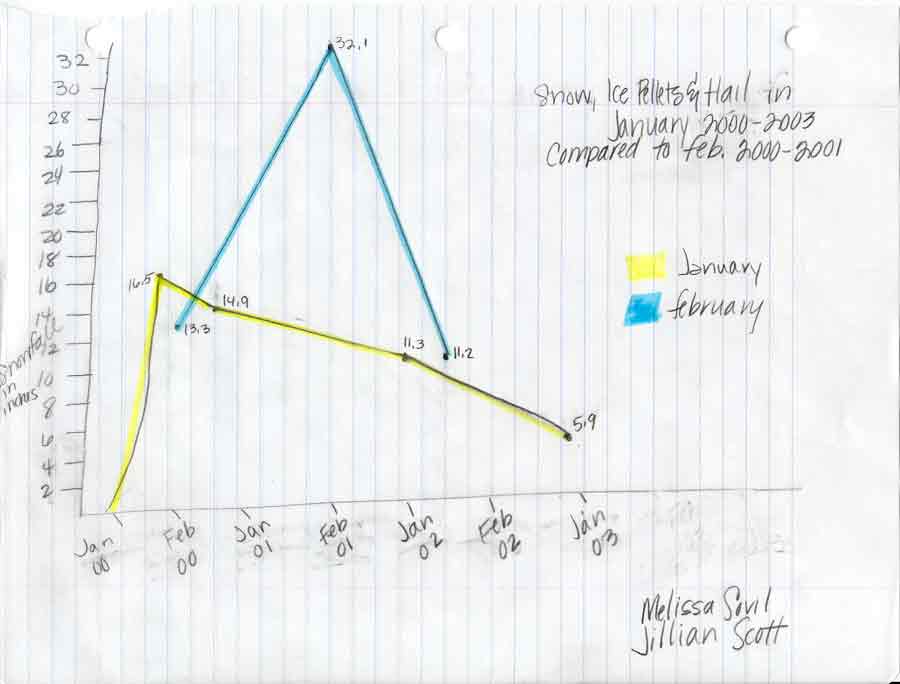
Data Visualization
Exercise II
We'll continue our exercise from last week by looking at the informational
graphs that the groups came up with using the January
2003 Duluth weather data from NOAA's Northland
Climate page.
Graphs using
Illustrator
Today, we'll learn a very basic method for using Illustrator to create
a graph that you can save for the Web or export to Photoshop
for further editing.
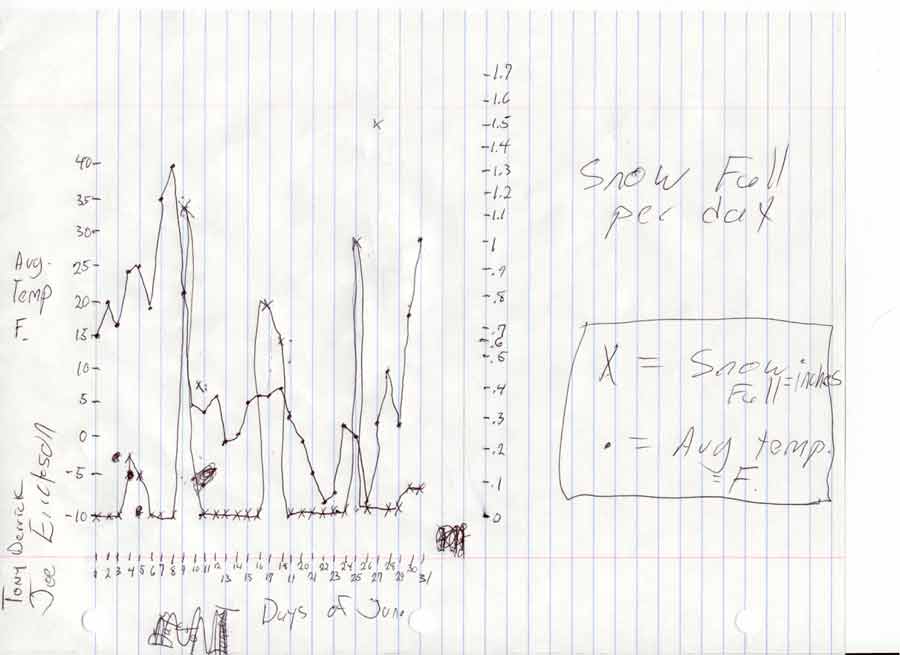
1. Consider the following set of data, which shows the largest daily
snowfalls for Duluth in January 2003 and compares it to the "water
equivalent" of each snowfall. What would this comparison tell us
that wouldn't be clear from the snowfall totals alone?
These numbers came from the January
2003 Duluth weather data from NOAA's Northland
Climate page.
| Daily Snowfall |
Water Equivalent |
| 1.5 |
.05 |
| 1.1 |
.06 |
| 1 |
.04 |
| .8 |
.02 |
| .6 |
.04 |
| .2 |
.01 |
2. Look at Illustrator's Help system: Help > Illustrator Help, and
then find "Graphs"
3. Complete a graph using these numbers (or numbers you derive from them)
to make your own graph using Illustrator (we'll do this together as well)
4. Save the graph you create as a .gif: File > Save for the Web. Call
it "snowfall.gif"
5. FPT the "snowfall.gif" to your "exercises" folder
in your "3220" folder on the server.
6. View "snowfall.gif" with your Web browser, copy the URL
from the location box, and paste it into the discussion Snowfall
GIF exercises on the discussion board.
Individual
Conferences Replace Class Meetings Next Week
Next week, we'll cancel both class meetings to hold individual conferences,
in which we'll talk about the results of your first project and your progress
on the second. Sign up for either Tuesday
2/25 or Thursday
2/27 using the discussion board. Specific directions for signing up
appear in the discussion introductions for either day. If you can't make
any of the times available, e-mail
me to make other arrangments.
Scatter
Graph using Illustrator in Color with Labels
Today, we'll learn more about using Illustrator for making informational
graphs, including how to add color and labels. I'll give you a handout
in class that takes this step by step.
But first we need some numbers to graph. We'll return again to the endlessly
fascinating weather
data from January 2003 from NOAA's Northland
Climate page to ask and answer the following question: Does temperature
influence to fluffiness of snow?
First we need to come up with some way of indexing the degree
of fluffiness for the following snow days during January: This is the
same table we used last time, arranged from most daily snowfall total
to least (not by fluffiness):
| Daily Snowfall |
Water Equivalent |
| 1.5 |
.05 |
| 1.1 |
.06 |
| 1 |
.04 |
| .8 |
.02 |
| .6 |
.04 |
| .2 |
.01 |
How might we "quantify" (to use Tufte's favorite word) the
fluffiness in one number rather than two numbers as above
so we could arrange the graph from most fluffy to least? We'll need such
a index of fluffiness to compare it to the following average temperatures
on the days in question.
| Daily Snowfall |
Water Equivalent |
Ave Temp |
| 1.5 |
.05 |
3 |
| 1.1 |
.06 |
22 |
| 1 |
.04 |
0 |
| .8 |
.02 |
6 |
| .6 |
.04 |
7 |
| .2 |
.01 |
24 |
Then, we'll be ready to enter our data in a Scatterplot graph using Illustrator
(see handout in class)
Mounting
Graphics on a Web Page
Today we'll also use Dreamweaver for the first time to mount some images
(our graphs) and text together and post the page on the WEb. This is how
I'll ask you to present your Representing Data
for a Decision Project.
Turning
in the Representing Data for a Decision
Project
- As we practiced on Thursday 2/20, use Dreamweaver to mount the graphs
and text together for your Representing Data
for a Decision Project on a page posted to the Web by Sunday
at 6 p.m. Just as you did with the first assignment, you can use FTP
to transfer the page file to your the folder "decision" inside
of "3220" in your "www" folder: www>3220>decision.
The page file should be called "index.html" so it will load
as the default page for the "decision" folder. Image files
should go in www>3220>decision>assets.
- When you have posted the page and graphics, visit that URL with your
Web browser to be sure the page and its graphics are working. If you've
transferred the files as suggested above, the page should be found at
<http://www.d.umn.edu/~youruserid/3220/decision>
with your actual userid (of course) replacing the italicized word.
- Copy the URL from the location box at the top of your Web browser
window, then post the URL along with your name in a message to the Webx
discussion entitled "Decision
URLs."
- On Tuesday, March 4, please bring a printout of the page (black-and-white
is fine) to class to turn in.
Before you
turn in your printout of the Representing Data
for a Decision Project, please "annotate" the printout
with comments, questions, issues, etc. that you want me to pay attention
to when I read it.
Introducing
the third project: Analytical Essay I (The Cultural
Work of an Image).
Bring your
Tufte and Bang books to class next Thursday.
Between now
and the end of the semester, I'll ask each of you to lead the class through
an exercise of your own devising in Photoshop, Illustrator or Dreamweaver.
Save the advice template (in Word) to your
Zip disk to prepare a handout later. This presentation will count as major
part of your Writing and Exercises
grade for the course.
Conferences
Next Week (no class meetings)
Sign up for conferences next week either on Tuesday
or Thursday.
Be sure to check back after a few minutes to make sure that someone who
posted at same moment didn't get your time slot (whoever is first on the
list will have posted first). We will not have class meetings next week,
though the room will be open and available to you if you want to work
on the computers.
Peer Techniques
"Peer Techniques" will be a series of hands-on demonstrations
that you and your classmates will conduct in class through the rest of
the semester. This presentation will be a major part of the "Writing
and Exercises" part of your grade.
1. Sign up for a Date
First, choose a date from the list of "Peer Technique" discussions
in Webx. There's a separate discussion for Tues, 3/25, 3/27, 4/8,
4/10, 4/15, 4/24, 4/29, 5/1. No more than 3 people can sign up for any
single date. Sign up for a date by
- checking that no more than two names are already posted into that
day
- posting your name to that discussion
- checking back after a few minutes to make sure that no one posted
at the same time as you and got in before you (if so, you'll need
to choose another day)
- If already you know the topic of your technique demonstration, check
the discussion "Peer
Techniques Topics" to be sure it hasn't already been reserved.
If not, post your idea right away. If there is duplication, the earliest
message in the discussion will get that topic and anyone posting after
will have to choose another.
2. Decide on a Technique
Check the discussion "Peer
Techniques Topics" to see what topics have and haven't already
been reserved. Decide on a technique to teach us using Photoshop, ImageReady,
Dreamweaver, Illustrator or other software available to us in the classroom
and relevant to the work of the class. A "technique" should
not just demonstrate a tool but actually shows us how to do something
useful or cool. Small and practical is as good as big and splashy. Ideally,
this would be a technique you've already used in your work for this
class. Plan on about 5 minutes of demonstration and perhaps a couple
more minutes of quesitons or helping individuals who had trouble completing
the technique.
3. Name and Reserve Your Technique
Post your topic for the Peer Technique Demonstration to the Webx discussion
is titled "Peer
Techniques Topics" along with the date you scheduled in step
1 above. Again, if there is duplication, the earliest message in the
discussion will get that topic and anyone posting after will have to
choose another.
4. Type Up Your Technique Handout
Break down your technique into a logical, explainable steps and type
them into the techniques
template.
5. Provide an Image?
Decide if you want to provide the class an image file to work on, or
if everyone will be able to do your technique with an image file of
their own. If you have an image file to distribute, post the image to
your folder www/3220/exercises as if it were a Web page, check to see
that you can view the image with your Web browser, then e-mail
me the URL of that image file in a message titled "peer technique
image": for example, <http://www.d.umn.edu/~youruserid/3220/exercises/imagefilename.jpg>.
Please do not e-mail me image files as attachments! I will put the
URL of the image on the course home page on the day of your peer technique
presentation.
6. Make Copies of Your Handout
Before your scheduled day, printout the techniques template and make
23 copies to distibute to the class so everyone can try your technique
as you demonstrate it.
7. Post Your Handout
Post the Word file of your handout to your folder "www/3220/exercises"
saved as yourlastname.doc. Using Netscape, try to visit the URL
<http://www.d.umn.edu/~youruserid/3220/exercises/yourlastname.doc>
and see if it gives you the option to download/view. E-mail
me that URL in a message titled "peer technique handout."
8. Practice!
You will want to practice your technique demonstration, ideally using
the instructor's station in the classroom when the room is available
as a lab. See the schedule
for times with CCtr 42 is not reserved.
Displacement
(A Horse is a Horse, Of Course, Of Course)
In looking for an image for your Analytical Essay
I (The Cultural Work of an Image) project, consider the possibility
of displacement in the context
of your image.
Ideas from
Tufte and Bang
Today, we want to collect, review and think about some critical ideas
from our books which may help us in writing the Analytical
Essay I (The Cultural Work of an Image). So we can do this collaboratively,
please
- look through your Tufte and Bang books (at our assigned readings so
far, but elsewhere if you see something that strikes you) and
- find one idea in each that you think is useful to note and remember
for this assignment.
- Then, post a message each to the Tufte and Bang discussions in Webx
(follow the directions in the discussion's header). Try to put the idea
and page number in the first line so they will display as the title
in the discussion list.
- Finally, look through the postings of your classmates and find one
to comment on (be sure to click the "reply" button directly
above the message you're responding to).
Conferences
Next Week
Classes are cancelled next week for individual conferences on the Analytical
Essay (turned in today) and the Picture Book
Project (due Monday, 4/14). Sign up for the conference either on Tuesday
or Thursday via the discussion
board.
Analytical
Essay 1 due Today
Today, we're turning in the Analytical Essay 1 (Cultural
Work of an Image). Be sure you include a copy of the image you're
discussing.
Peer Techniques
Today, we have "Peer Technique"
presentations from Petersen, Lannon and Thompson. Below are links to image
files that you may use to do the exercises. Save each to your exercises
folder, and open with Photoshop.
Camera Work
Today, we'll work with the idea of "camera work" for the Picture
Book Project.
1. Get out your Freytag's Pyramid handout and map a story into its
parts: exposition, rising actions, climax, etc. You can choose the poem
from last time, your own story you started, or a new one that you're
thinking about for the Picture Book Project (remember this is not to
be a children's story).
2. Decide on several "shots" (components of scenes) you'd
like to design. Think about the emotional dynamics of these images.
3. Go to the Internet Movie Database,
do a search for several of your favorite movies, and look on each movie
page for the link Promotional > photo gallery. Find some good models
of how camera work (exemplifying Molly Bang's principles) can realize
and intensify the emotional purposes of the filmmaker in these scenes.
Look especially for shots that are intended to invoke similar kinds
of emotions as those in your story.
4. Draw a line down the center of a blank sheet of paper from top
to bottom, and then draw two lines from side to side to divide the page
into thirds to look something like this:
5. In the squares of the paper, storyboard some shots/scenes from your
Freytag handout, applying Molly Bang's principles and using the examples
of camera work you found from the movies.
Freytag
You can print out extra copies of the Freytag handout.
Peer Techniques
Today, we have "Peer Technique"
presentations from the following people. Below are links to any image
files that they have provided for you to use to do the exercises. Save
each to your exercises folder, and open with Photoshop.
- Melissa
- Elizabeth (Lasso Tool)
- Kristin
(Quick Mark Borders and Frames)
Journal
Entry #2 and Pairing Up
Write a short paragraph in the Webx discussion "Picture
Book Project Concerns" detailing your main concerns in completing
the Picture Book Project, both technical and
creative. What questions do you most want answered?
Then, pair up with one of your classmates, and spend 10 minutes comparing
notes about Picture Book assignment. Look for common concerns and possible
answers.
Rob Wittig,
e-lit author and researcher, will speak at the Tweed Museum's Lecture
Gallery on Tuesday, April 15 at 10 a.m. Visit Wittig's
site to see examples of his work (best if viewed with Internet Explorer).
His talk is entitled, "Creation at the Crossroads of Literature,
Design and New Media."
Turning in the
Picture Book Project (Monday and Tuesday)
Your Picture Book Project will be due to be posted to the Web as a Photoshop
"Web Album" by Monday, April 14 at
6 p.m. See the assignment page for
complete details. Be sure to post your name and the complete URL of the
project to the Webx discussion "Picture
Book URLs."
On Tuesday, April 15, please bring
a printout of the page images to turn in with handwritten annotations
that point out your efforts to apply Molly Bang's principles, the concept
of story vs. simple chonology as we discussed using the Freytag
handout, the idea of camera work, and anything else that seems relevant
for me to know or notice.
Peer Techniques
Today, we'll have Peer Technique presentations
from three folks:
- Samantha Wyffels (TV type, no image needed)
- Kyle Kalmi (image
one, image
two for Image on Monitor Effect)
- Joe Erickson (Matrix Shadow Effect, no image needed)
Picture Book Help
Read over the postings to the Webx discussion Picture
Book Project Concerns and reply to at least two. While being sympathetic
is nice, pratical advice is especially helpful.
4/14/03
Conferences Scheduled,
Classes Cancelled
We'll be cancelling the next two class meetings for conferences. Sign
up for a conference either on Thursday
4/17 or Tuesday
4/22.
Next Project
Introducing the Graphic Represenation of a Process
Project.
Peer Techniques
Today, we'll have Peer Technique presentations
from three folks:
Directions Online
Note that the Peer Techniques directions are now available on the Web
at my Techniques
Site.
4/29/03
Graphic Process:
project due, URL posted, annotation turn-in
The Graphic Represenation of a Process
Project is due to be posted to the Web by 5 p.m.
on Thursday. Also:
- send a message to the Webx discussion "Graphic
Process URLs" with your name and the complete URL of the project
(in that order) by 5 p.m. on Thursday,
and
- place an annotated printout of the project in my box by noon
on Monday, 5/5
Conferences Next
Week, No Class Meetings
Sign up for conferences next week either on Tuesday
or Thursday
to discuss your Graphic Represenation of a Process
Project and your ideas for the second Analytical
Essay project. Bring your first Analytical Essay to the conference.
If You've Already
Done Your Peer Technique Presentation
If you've already given your Peer Technique presentation, please go to
the student section of Techniques
Site to make sure that your directions appear as a link. This is necessary
for your to get full credit for the activity. If you don't see your directions
linked to this page, please e-mail me either
- the date you sent the URL of the Word file to me, or
- URL of the Word file posted to the exercises folder in your "www"
folder.
Peer Techniques
Today, we'll have Peer Technique presentations
from the three folks below. Please download any images images provided
and open them in Photoshop to be ready to follow along.
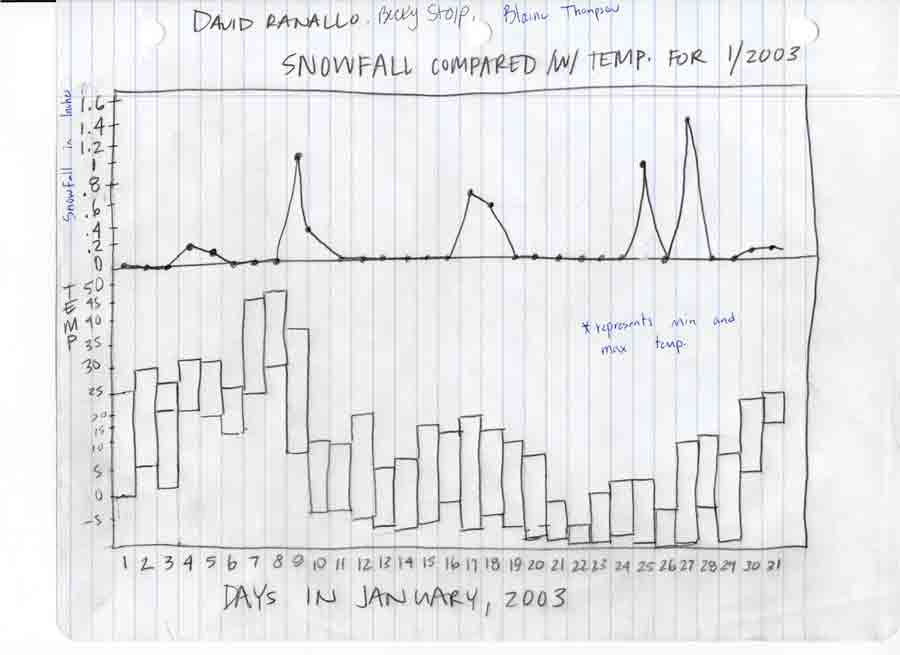
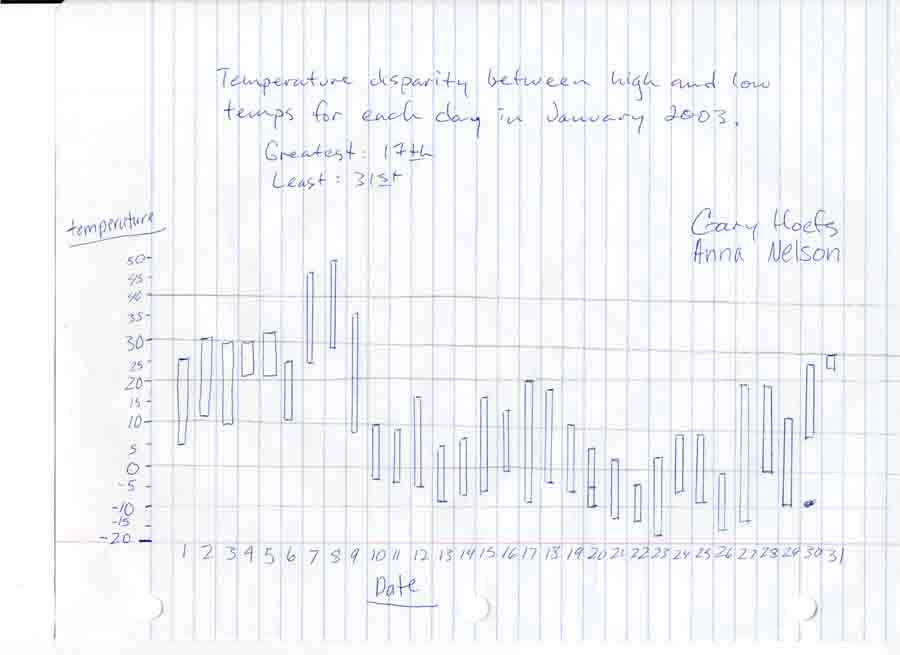
- Becky Stolp (image)
- Anna Nelson (image)
- Gary Hoefs
Journal Entry #3:
Applying Tufte to Graphic Process
Write a paragraph to the Webx Discussion Journal
#3 about one of Tufte's visual examples from Chapter 4 or 5, applying
its precepts to your own Graphic Represenation
of a Process Project. What does Tufte make you realize you're
doing right, or that you want to do differently? Be sure to indicate the
page number of the graphic you choose.
|
