Previous Today's Specials
Spring 2002
 Let's compare the
animation
of Mindard's map of Napolean's campaign (third down on the page) to
the animated map of Salem
Witchcraft Hysteria. Which is better at showing the sequence of,
and relationship among, the events and causes? (4/25) Let's compare the
animation
of Mindard's map of Napolean's campaign (third down on the page) to
the animated map of Salem
Witchcraft Hysteria. Which is better at showing the sequence of,
and relationship among, the events and causes? (4/25)
Journal Entry #11.
What relationships or comparisons will your graphic of a process
show? Can you describe a scenario in which an audience would find
your graphic representation of a narrative useful, revealing, or compelling?
(4/25)
Here again is Michael
Friendly's page with the what
can be done with Minard's map. (4/23)
Journal Entry #10.
Thinking about your Graphic Representation of a
Process Project:
A. Briefly explain your current idea for a topic or possible topics
for this next project. Think on paper about why you chose this topic (or
the relative strengths and weaknesses of the alternatives you're choosing
among). If you have no ideas, write about why you think you're blocked
and what you don't like about any of the ideas you've had.
B. Answer the questions that Tufte suggests at point #1 on page
68. Tufte says that answering these questions for your audience, early
in your presentation, helps to ensure that you're making clear what your
presentation is doing and why it's important.
C. Then, list possible "factors, causes, techniques or other
elements" (see the first sentence of the assignment)
you might include in your graphic(s). Which of these "factors, causes..."
most speak to the "problem" of explanation or interpretation
which your graphic(s) will solve? (4/23/02)
Your Picture
Book Projects are due by the beginning of class on Tuesday,
April 16. You can submit them either
- as a Web Page (the URL posted to the Discussion
Board, which we'll learn how to use in class on Thursday, April
11) or
- as a print document. (4/16/02)
See directions and suggestions for both Web and print options at the
"Submission" section of
the Picture Book Project page. (4/11/02)
Today, we'll learn
about the next assignment, the Graphic Representation
of a Process Project. (4/16/02)
A good example of
a Graphic Representation of a Process would be Charles Joseph Minard's
1869 graphic showing disastrous March of Napoleon's Army on Moscow. Tufte
has called this piece of work "the best graphic ever produced."
In this military campaign, which lasted from June 1812 to January 1813,
an army of 422,000 soldiers was reduced to 10,000 by the brutal Russian
winter. Michael Friendly's site Geovisualization
and Minard's Map shows variations and enhancements on Minard's original.
See especially his page, what
can be done with Minard's map. (4/16/02)
Journal Entry #9.
Questions about Minard's map:
- How many data points can you count?
- How many layers (or sets of variables) are included?
- Do you see any examples of Tufte's direct labels, encodings, and/or
self representing scales?
- In what ways is the graphic quantified? Are there other ways it could
be? (4/16/02)
Today, we'll be learning
to use the discussion board. Begin by following these steps:
- Use the "Discussion" link on the upper left of this
page.
- At the login page, enter your UMD user id and the password "webx".
- Then, from the screens that follow, choose the links "Craig
Stroupe" > "comp3220" > "Picture
Book Concerns (interactive journal) 4/11/02" and post a message
in response to the prompt. (4/11/02)
We'll continue having
presentations of "Favorite Photoshop Tool/Technique/Effects."
Please the link to
your Representing Data for a Decision
project on the URLs page. Please e-mail
me if you don't find your URL, or if it isn't working correctly.
Warm-up Writing
(5 minutes, to be turned in, counts as quiz):
In the preface, Rudolf Arnheim writes of Bang's book,
You are talking about a play of dramatic visual forces.... This makes
your story so alive on each page. It gives to all its shapes the strength
of puppets or primitive wood carvings, not giving up abstractness but
on the contrary exploiting its elementary powers.... (7)
Discuss in detail one example of this technique that Arnheim is talking
about from our readings for today (8-41). Try to explain in words the
emotional power of a particular image in the Bang book.
(Hint: Bang will often try out different versions of the same image before
deciding on the most effective. You could discuss one of these decision
processes as she's basically taking us along as she "discovers"
principles of visual design.) (3/28)
Today, we'll be creating
Molly Bang-style versions of some famous
paintings using Photoshop. See Bang pg. 96, exercise 1. This is the
style I'll expect for the Picture Book
Project. (3/28)
You should post your
Representing Data for a Decision projects
to the Web by midnight, March 26. For help
with transferring HTML (Web-page) files from your disk to your Web folder
on the server, see FTPing
using Dreamweaver or WS-FTP. (3/26)
Today, we are looking at the next assignment, the Picture
Book Project. Consider the questions at the picture
book page from the Ideas site when looking at our examples in class.
(3/26)
Lab or software access
is a concern for many of you, especially during Spring Break. Here are
some resources for coping with the access question. (3/16)
Labs and the Help Desk:
The Help Desk tells me that SBE 17 will be open during
Spring Break, M-F 7:30 a.m. to 5:00 p.m. Though SBE 17 is a Mac lab,
you should be able to open up image files and Web pages with the Mac
versions of Photoshop and Dreamweaver. See ITSS's Full-Service
Lab site for locations, times and software availability. If you
have questions, call the help desk at 726-8847 or e-mail
them.
Editing Web Pages:
You don't necessarily need to use Dreamweaver to edit your Web
pages. If you have Netscape, for instance, you can edit any Web page
that you're browsing by choosing File > Edit Page. Doing this
will open the page in Netscape's "Composer" program. This
is a simpler, less powerful editor than Dreamweaver, but does many of
the basic things you'll need. There are many extensive Web sites out
there that have been created just in Netscape's free Composer program.
Free Dreamweaver at Home for 30 Days:
You can download a working trial copy of Dreamweaver onto your home
computer for 30 days by visiting Macromedia's Dreamweaver
download site.
Image Editing: You can do basic
image editing using other programs, such as PhotoDelux, Paintshop Pro,
or other applications that come free on your computer, or with digital
cameras. You can also check out c|net.com's
image editing download page, which includes free programs and trial-versions
(please read the descriptions carefully before downloading; some of
the programs listed are upgrades, etc.)
Help Each Other: If you find other
helpful ways of dealing with these issues, please share them with your
classmates via the class
alias.
Journal Entry #5 (to
be turned in now, returned later to go into your journal)
Write four informal statements/lists about the current state of your
Representing Data for a Decision project
labeled with the letters COSQ:
Concerns: what about the project are you
figuring out, worried about?
Obstacles: what specifically is in the way
of your happily completing the project right now?
Strengths: what do you like about your
project, your process? What are you confident about? What do you have
going for you?
Questions: what questions do you have
for me, for yourself, to put to someone else?
(3/12)
We'll be trying out
Dreamweaver to learn how to create Web pages for our Representing
Data for a Decision project.
- See Lynda Weinman's Dreamweaver
Basics tutorial.
- Today, try to get through pages 54-66 of the tutorial.
- Then see UMD's page about how
to transfer your files using FTP to your personal Web folder on
the UMD server. Other tutorials can be found among the "How To's"
below.
Journal Entry #4
Look again at the Salem
Witchcraft hysteria Map and read the "How
Could this Happen" page. Thinking about Edward Turfe's 3 technicques
from page 13 of Chapter 1, answer the following questions in an information
paragraph:
- What does the Salem Village map quantify?
- What techniques for depicting quantitiues does the map use or not?
- What factors or variables are important in the verbal explanation
that could be represented (or represented better) in the graphic explanation?
(2/28)
Today, your groups
will present an 8-10 minute presentation to the class a graphic from the
Gallery
of Data Visualization at Canada's York University. In this presentation,
I'll ask your group to come up to the instructor's station, show the graphic
on the projector and
- explain what the graphic shows,
- going point by point, demonstrate exactly how your chosen graphic
display of evidence fulfills (or not) Edward Tufte's six
principles in Chapter 2.
- say whether or not this example would make a good model for part or
all of the Representing Data for a Decision
project (not all of them will).
You will have only about 10 minutes at the beginning of class next Tuesday
to prepare, so I'll ask you to exchange e-mail addresses today so you
can consult and coordinate over the next 5 days. (2/21 and 2/26)
Groups:
A brief description of each visual below can also be found at the Gallery
of Data Visualization page.
1. Matt, Joe Erik: Goosed
Up Graphics #1, Degoosed....
(11:15 - 11:35)
2. Bess, Greg, Jake: Boxplot
of the NJ Pick-it Lottery (11:25 - 11:35)
3. Nicholas R, Andi, Molly, Mark: TBA (11:35 - 11:45)
4. Charlie, Nicholas S., Nicole: US
Visibility Map (Monmonier) (11:45 - 11:55)
5. Karen, Tina, Casey: Unhifting
the sands of time (11:55-12:05)
6. Nissa, Christin, Teri, Sarah: Animated
Triplot (12:05-12:15)
Terms: Standard
Deviation,
By February
26, please choose a "Favorite Photoshop
Tool/Technique/Effect" to present in a five-minute demonstration
to the class this semester.
The next project will
be Representing Data for a Decision.
Please take a look at this project page. We'll look at a map
of the Salem Witchcraft hysteria from the Discovery Channel site as
an example. (Compare the insights of that map to the animated
map of the same data from the University of Virginia.) Also, we'll
look at Henry Beck's innovative 1932
map of the London Underground ("The Tube"), which still
assists millions of people a year in making decisions about getting around
London. Notice how these two representations combine alphabetic
and iconic languages. (2/19)
Invention activity:
clustering (Journal entry #2)
1. On a blank sheet of paper, scatter a word or two indicating the following
topics that are familiar or significant to you. Draw a little circle around
each word or phrase to bubble them.
- two places
- two people
- two events
- two gatherings
- two subcultures (crowds)
- two classes or books in your field (intended vocation, avocation,
passion)
2. Then make links and bubbles for more words, ideas and associations
that you can connect to these bubbles to make a sprawling cluster.
3. At the bottom or back of the sheet, write down three possible situations
or audiences suggesting a decision (or kind of decision)
Submit your Web-verson
logo, print-version logo, banner and icon to the drop
folder. Follow the directions for naming
and submitting these items at the bottom of the Logo assignment
page. As of Monday morning, 2/18, at 9 a.m., I have emptied the folder
so if you've placed anything in it for me since the last assignment, please
resubmit it.
Note: the drop folder was not operating part of Monday and wasn't
back up until early Tuesday morning, 2/19. I will accept your images
as on time until 6 p.m. Tuesday evening, 2/19.
You can quickly reduce
GIF or JPG images using the free online
"Crunchers" from Spinwave. See my Internet
Resources page for more such links.
Please take a look
at this tutorial
on contrasts (2/14).
These are some Web
resources on color: If you find others you think are useful, please send
me the Web address by e-mail and I'll add them to the list.
Our next assignment
is the Logo. Please read this article
on logos from webreference.com.
By Monday,
February 11 at noon, I'm asking everyone to review the logo
criteria and samples and to create a new, final list of 12 key criteria
for the logo, banner and icon assignment. You can create this list electronically
by copying and pasting from the logo criteria
and samples page, the article
on logos or elsewhere. List the criteria in order of importance.
E-mail the list to me only <cstroupe@d.umn.edu>
by Monday at noon by pasting the list into an e-mail with the subject/title
line, "3220 final criteria." No attachments, please!
By next
class meeting, please purchase somekind of inexpensive, flat
binder (not the big three-ring ones!) to organize and keep your in-class
writings. We'll call this your "Journal,"
though you won't be expected to write anything personal in it.
I will give you a journal-entry number for each writing we do when I
assign it. If you put any of your own notes or reflections in it (having
to do with the class), please label them A-Z.
Here are the criteria
and samples for the Logo assignment which you have suggested.
Here is Journal Entry
#1: Write 3 paragraph-long analyses of the use of color in 3 logos from
the criteria and samples page (see link below). In each of these analyses,
correctly use 3 terms from Weinman's vocabulary on pages 156-159. For
an example of such an anaylssis, take a look at Weinman's own analyses
of Web pages on 160-161.
By Wed,
Feb 6 at 6:00 p.m., send the class
alias your list of criteria for evaluating logos, the URL of a sample
logo that you've found, and a brief commentary about that sample logo's
realization (or not) or your criteria list. Please title your e-mail "logo
criteria for 3220" to help us all recognize and properly your
message when we get it. Also, please no attachments (paste or type the
text into the body of the e-mail).
Please take note of
the new "Assignments" link on the left-hand menu of these pages.
Also, be sure to follow the updated day-to-day readings and plans on the
"February" page, from the link on the left-hand menu under "Schedule"
The first assignment
will be the Autobiography in Four Images, which
will be due February 5 by class time. Be
sure to read the submission directions at the bottom of the assignment
page. On this assignment page, you will
also now find a link directly to the Drop Folder. Bring a hard copy
of your self commentary to class on Tuesday.
You can quickly reduce
GIF or JPG images using the free online
"Crunchers" from Spinwave. See my Internet
Resources page for more such links.
Four
views of Duluth (representational spaces)
Next
Tuesday, bring in a postage-stamp-drivers-license-sized picture
of yourself (black and white, Xeroxed, low quality okay). I will use these
on my roll cards to help me learn names and faces.
This page will be
the central point of arrival and departure for the class each day. I will
continually replace the content here with the most current news and reminders.
Older "Today's Special" items from throughout the semester will
be archived at a page available from the link below.
Choose one of the
following two graphics to work with today--or, better yet, work with one
of the 10 images you've chosen for the first assignment, if you have one
with you on a disk. Be sure that the image is a JPEG (jpg) by looking
at the "extension" on the file name (the abbreviation after
the period).
Please read the syllabus
and take a look at the schedule for January. Other
due dates for projects are posted for the semester, but specific readings
beyond the first project due date do not appear because university-wide,
software-availability issues will probably necessitate basic changes.
Sample Web Graphics
Slow-loading
graphic (George Mahlberg, click "Cool Cuda")
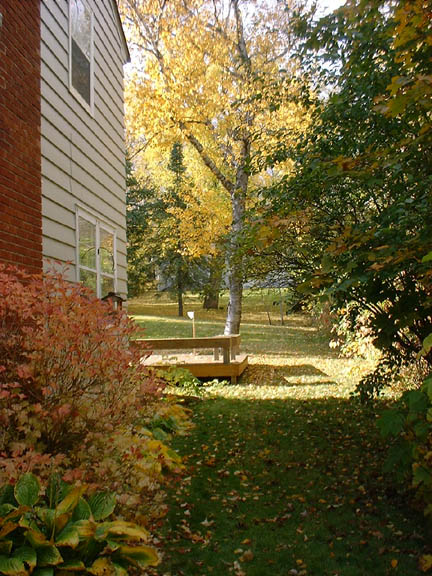
Vector graphics (gwenda.com)
Bitmap or
Raster graphic (sideyard)
|
